
Getting Started
Using this site, you can explore changes in demographics and infrastructure across Cape Town, Durban, and Johannesburg. Below are some tips for making your own maps.
Tips for making maps:
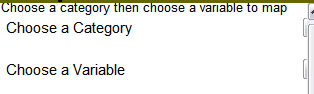
- Choosing Variables to Map - You can map two types of variables using this website. The first type come from the South African census and are included in the dropdown boxes on the top left of the mapping page. These allow you to examine population dynamics across each city. The second set of variables are the locations of infrastructure such as roads, schools, housing, and healthcare facilities collected from government agencies. To map the census variables, choose a category - such as population - then a specific variable from drop down menu - such as population density - on the left side of the screen. Note that you can only map one variable from the dropdown menu at a time.
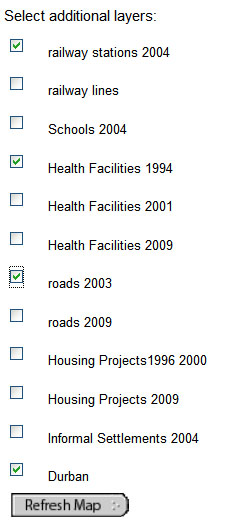
To map infrastructure variables, on the left side of the screen, check the box next to the item you would like to map and then click on the "refresh map" button. Note that you can map multiple infrastructure variables at the same time, however, mapping too many items at once may cause your map to appear very cluttered.
- Toolbar-
 The toolbar in the top right of the mapping page allows you to change the views of the maps you create and view data about a specific community, along with other functions. You can find a full description of each tool by clicking on the help button on the top of the mapping page. You may find it useful to print out the help page to reference as you are making your maps.
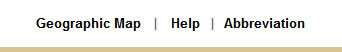
- Variable Names - When you use the identify tool
 a table will appear with information for the selected community. The meanings of the variable names can be seen by clicking on the "Abbreviation" link on the top right of the mapping page. It may be helpful to print out this list of variables for reference while you are making maps.
- Map Legend - In order to view the legend for your map click on the legend button
 in the toolbar on the upper right part of the mapping page.
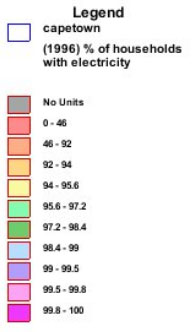
In the legend, those variables that have no unit value appear in gray. In the tables, they will appear as a -99 or -999. This means that the information for a particular variable is not available for that unit.
- Saving maps - In order to save the maps you make, you can click on the toolbar print icon
 in the menu on the top right of the mapping page. This will allow you to print your map. It will also allow you to cut and paste your map into a document file, which can then be saved.
To begin making maps, click here.