
Philadelphia, 1850-1900
“Before The Philadelphia Negro
This page provides documentation and downloadable material for the Philadelphia project. An original analysis of 19th Century trends in black-white residential patterns in Philadelphia was published in this article:
John R. Logan and Benjamin Bellman. 2016. “Before The Philadelphia Negro: Residential Segregation in a Nineteenth-Century Northern City” Social Science History 40: 683-706.
Abstract: Although some scholars treat racial residential segregation in Northern cities as a twentieth-century phenomenon, recent research on New York and Chicago has shown that black-white segregation was already high and rising by 1880. We draw on data from the Philadelphia Social History Project and other new sources to study trends in this city as far back as 1850 and extending to 1900, a time when DuBois had completed his epic study of The Philadelphia Negro. Segregation of “free Negroes” in Philadelphia was high even before the Civil War but did not increase as the total and black populations grew through 1900. Geocoded information from the full-count data from the 1880 Census makes it possible to map the spatial configuration of black residents in fine detail. At the scale of the street segment, segregation in that year was extraordinarily high, reflecting a micro-pattern in which many blacks lived in alleys and short streets. Although there was considerable class variation in the black community, higher status black households lived in areas that were little different in racial and class composition than lower status households.
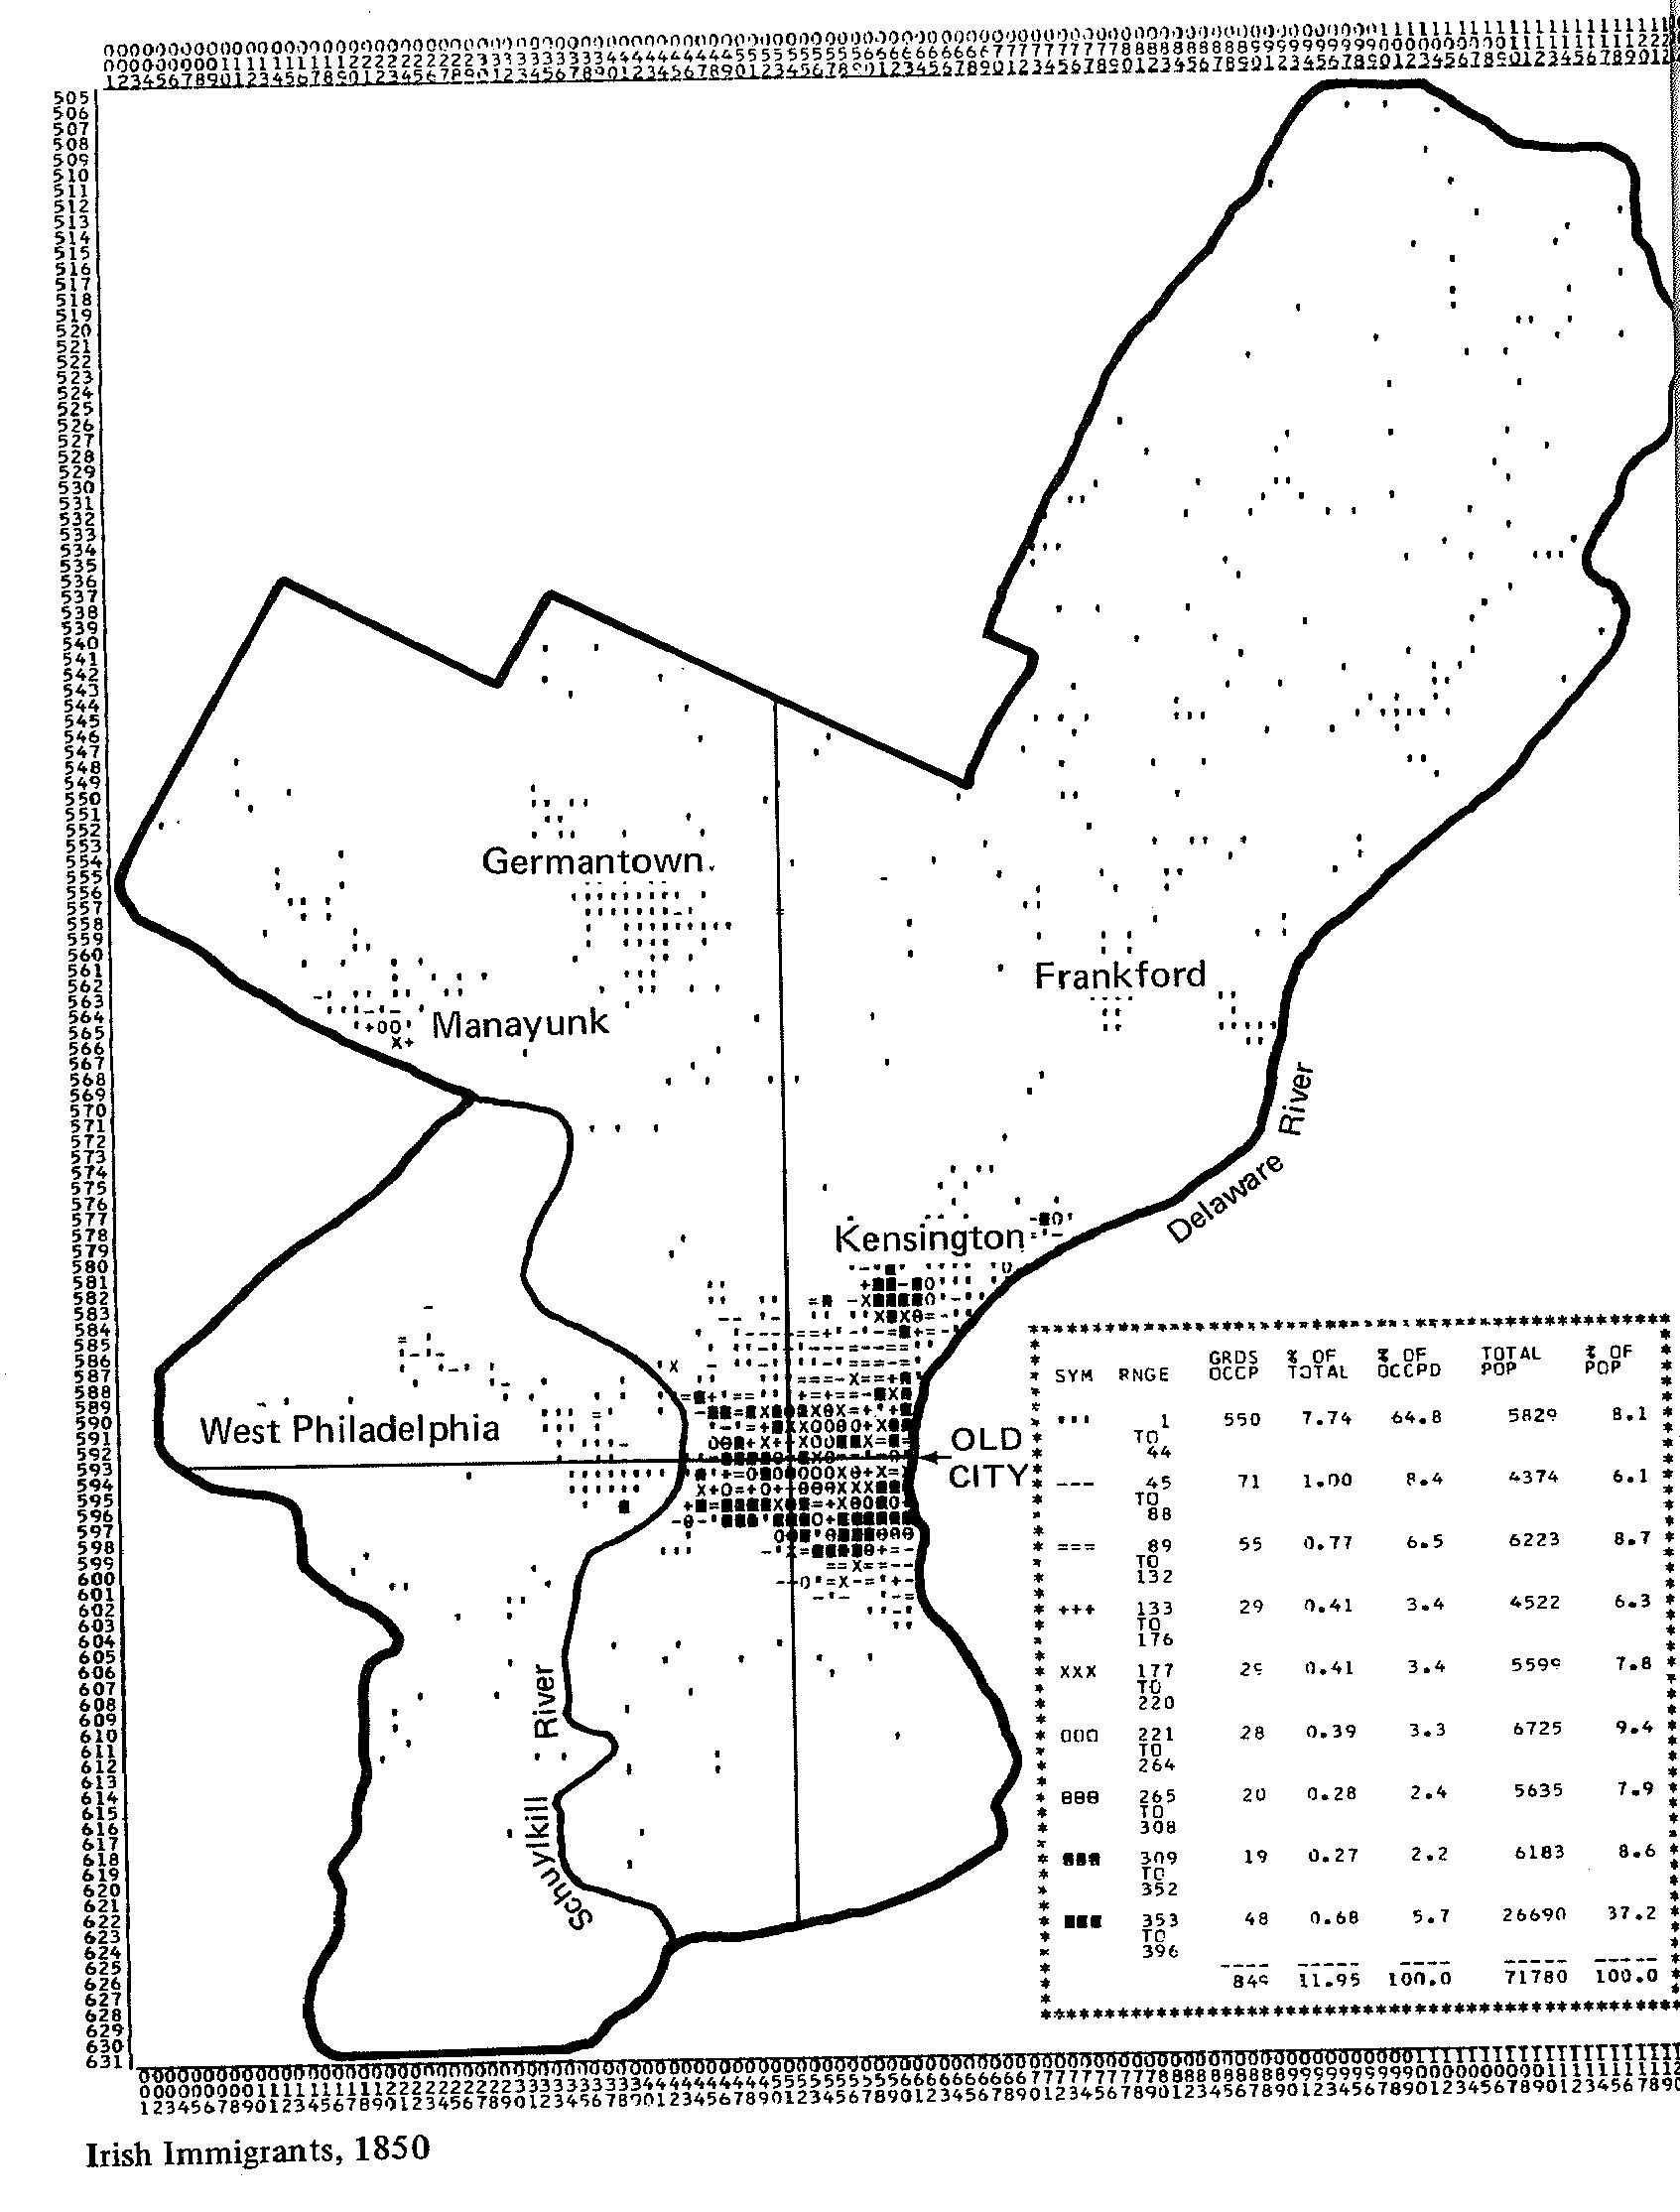
This study assembles materials from the Philadelphia Social History Project (PSHP), organized by Theodore Hershberg, in a more usable form for spatial analysis. The PSHP assembled data from census manuscripts in each decade from 1850 to 1880, estimating the racial composition of small areas that averaged one and a quarter city blocks. The original PSHP race data by grid cell are available through the Inter-University Consortium for Political and Social Research. A difficulty in using the file is that grid locations are identified only by a set of X and Y variables that do not correspond to a map coordinate system. For example, here is the PSHP map of the location of Irish immigrants in Philadelphia in 1850 (reproduced from Alan Burstein, “Immigrants and Residential Mobility” Pp 174-203 in Theodore Hershberg, ed., Work, Space, Family and Group Experience in the Nineteenth Century.)
We have imported the grid cell points into a GIS developed by the Urban Transition HGIS for 1880. The shapefile for these data, including black and white population as well as population of various immigrant groups in the decades 1850-1880, can be downloaded from this link: PSHP maps.
An additional source for more detailed analysis is our 1880 geocoded map file for Philadelphia. For convenience the map showing locations of predominantly white and predominantly black buildings is made available here as a high-resolution .png file: 1880 building map. At a zoom level that shows large areas of the city, the shading of polygons representing enumeration districts (EDs) shows the share of black residents in each area in 1880. Zooming in on a smaller area will display street names and show individual buildings, color coded as predominantly white or black. Additional data and features are provided on the separate 1880 web-based GIS system
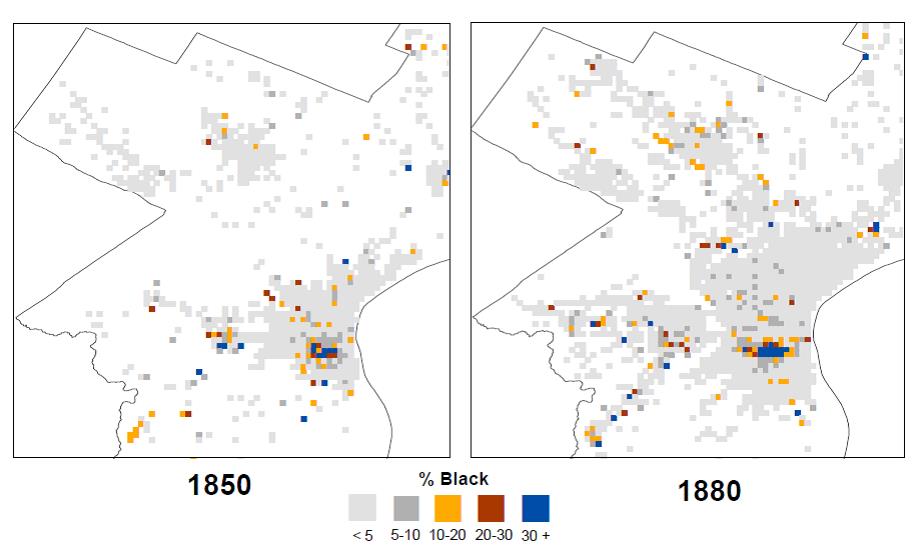
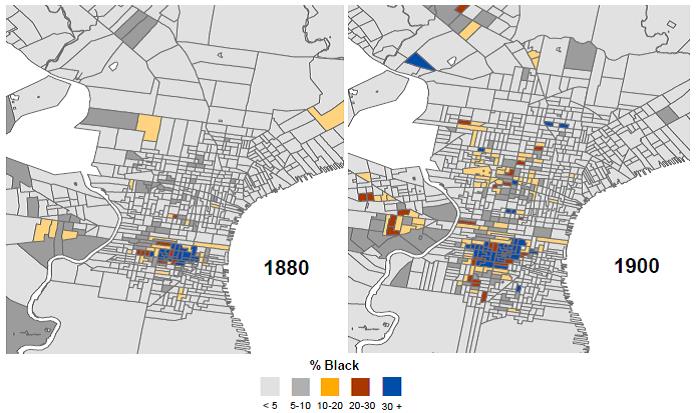
Less detailed maps shown below display the evolution of black clusters in the city from 1850 to 1880 using PSHP data and from 1880 to 1900 using ED-level data:
Some major findings from our analysis of these data:
- In 1854, all of the jurisdictions within Philadelphia County were consolidated into a single City of Philadelphia, greatly enlarging the original city. In 1850 Philadelphia was the fourth largest American city with over 120,000 residents, while five other adjacent cities within the same county were among the nation’s top thirty: Spring Garden District (#9), Northern Liberties District (# 11), Kensington District (#12), Southwark District (#20), and Moyamensing District (#27). In 1860, after consolidation, the new City of Philadelphia was the nation’s second largest (more than twice as big as Brooklyn, the third largest).
- Countywide, blacks comprised close to 5% of the total in 1900, the same as in 1850. While the county tripled in population, the black population also tripled. However, blacks were unevenly settled among community areas, and they were especially over-represented in the original city of Philadelphia (nearly 10% of residents in 1850, close to 13% in 1880, rising to over 16% in 1900 – not so much due to increasing numbers of black residents but rather to the decline in the number of whites).
- Segregation of blacks was high as early as 1850 when measured using the PSHP grid cells. The Index of Dissimilarity (D) was .59 at that time, barely below the .60 that contemporary social scientists consider “very high.” Segregation then barely changed through the nineteenth century.
- In this whole period, black residents were highly clustered in the eastern section of the original City of Philadelphia, including the Seventh Ward studied by W.E.B. DuBois and areas close to it. The pattern of black settlement was very stable from 1850 through 1880 although the Center City cluster had extended both east and west by 1880.
- As the black population doubled between 1880 and 1900, the main areas of black residence expanded around their perimeter and a new area was established by 1900.The disproportionately black area in the central zone continued its expansion to the south (encompassing most of Moyamensing and Southwark), and north of Vine into Spring Garden and Northern Liberties. A new large cluster of disproportionately black EDs also was formed in parts of the former Penn and Kensington Districts. Hence, although the degree of black-white segregation barely changed through the last half of the nineteenth century, its spatial pattern evolved.
- A particularly noticeable feature of the spatial pattern in the main area of black settlement was the concentration of black residents on alleys and short streets. Whereas many blocks and EDs could be described as racially mixed, there was separation within them as whites predominated on many major streets and blacks in alleys. A consequence of this micro-level pattern is that if we measure segregation (D) at the scale of street segments, it was extremely high in Philadelphia in 1880, a level of .88 that is even higher than segregation in 2010 at the scale of census tracts (.73).
- A final question that we studied is whether segregation was conditional on social class. An important conclusion in DuBois’s work is that there was substantial class variation within the black community at the time of his survey. Using people’s occupational standing (SEI) as a measure of class position, we find that blacks almost uniformly lived on predominantly black street segments regardless of their social class.