
1880 Maps: 39 Cities
Click here to download shapefiles and data for the 1880 counties and cities.
Creating accurate historical maps for cities in 1880 posed several challenges, and it was not possible to complete this task for every city. The Urban Transition Project selected a sample of 39 cities. As shown on the following table, these included the 26 largest cities in the country, from New York (which at that time included only Manhattan and part of the Bronx) with 1.2 million residents to New Haven with fewer than 63,000. Additional cities were chosen mainly to extend the geographic range of the project to include smaller cities in the Midwest (like Kansas City and Minneapolis), in the South (like Charleston and Atlanta), and in the West (like Denver and Oakland).
Cities in Study Sample by Population Size and Rank in 1880
Rank
|
City |
Population |
Rank
|
City |
Population |
Rank
|
City |
Population |
||
1
|
New York , NY |
1,206,299
|
14
|
Washington , DC |
147,293
|
30
|
Kansas City , MO |
55,785
|
||
2
|
Philadelphia , PA |
847,170
|
15
|
Newark , NJ |
136,508
|
33
|
Columbus , OH |
51,647
|
||
3
|
Brooklyn , NY |
566,663
|
16
|
Louisville , KY |
123,758
|
34
|
Paterson , NJ |
51,031
|
||
4
|
Chicago , IL |
503,185
|
17
|
Jersey City , NJ |
120,722
|
36
|
Charleston , SC |
49,984
|
||
5
|
Boston , MA |
362,839
|
18
|
Detroit , MI |
116,340
|
38
|
Minneapolis , MN |
46,887
|
||
6
|
St Louis , MO |
350,518
|
19
|
Milwaukee , WI |
115,587
|
40
|
Nashville , TN |
43,350
|
||
7
|
Baltimore , MD |
332,313
|
20
|
Providence , RI |
104,857
|
43
|
Hartford , CT |
42,015
|
||
8
|
Cincinnati , OH |
255,139
|
21
|
Albany , NY |
90,758
|
45
|
St Paul , MN |
41,473
|
||
9
|
San Francisco , CA |
233,959
|
22
|
Rochester , NY |
89,366
|
49
|
Atlanta , GA |
37,409
|
||
10
|
New Orleans , LA |
216,090
|
23
|
Allegheny , PA |
78,682
|
50
|
Denver , CO |
35,629
|
||
11
|
Cleveland , OH |
160,146
|
24
|
Indianapolis , IN |
75,056
|
51
|
Oakland , CA |
34,555
|
||
12
|
Pittsburgh , PA |
156,389
|
25
|
Richmond , VA |
63,600
|
54
|
Memphis , TN |
33,592
|
||
13
|
Buffalo , NY |
155,134
|
26
|
New Haven , CT |
62,882
|
63
|
Omaha , NE |
30,518
|
The division of states and territories into counties has been remarkably stable in the 20th Century. In the 19th Century, however, especially as the population grew in frontier territories, new counties were established, and there were numerous name changes and boundary adjustments. The definitive source for information about historical county maps is the Atlas Project of the Newberry Library . The Atlas Project documents and maps every legal change to county boundaries from the seventeenth century to the present for every state. These maps can be viewed on-line, and they can also be downloaded as shapefiles.
In 1880 most of the country was included in the Census. The Dakotas and Indian Territory were not. In these areas there was a special enumeration by reservation, but it was not tabulated or transcribed, and therefore these Territories are excluded from our data files. Other missing counties are found elsewhere in the West. In these cases, to the best of our knowledge, the residents have been included in the returns for neighboring counties, so while there is a loss of geographic specificity the full population is accounted for.
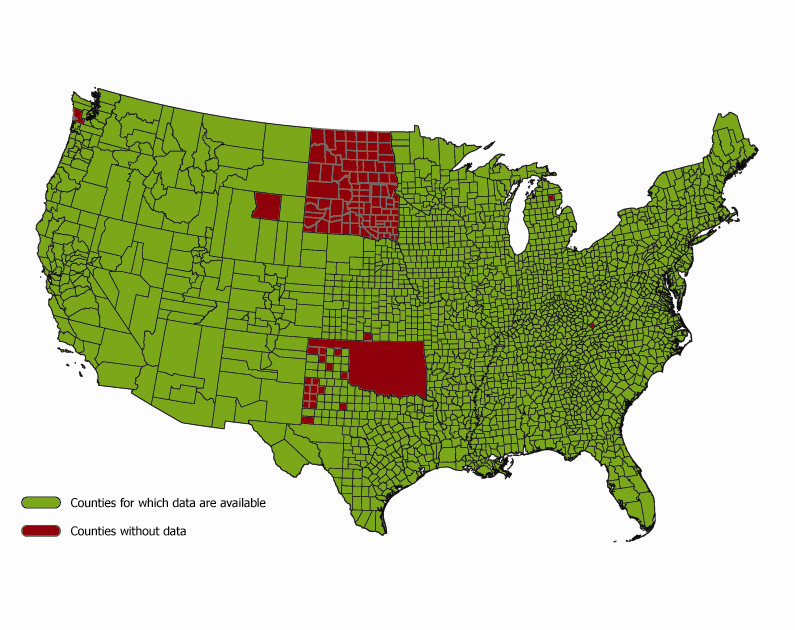
County map in 1880, showing areas without defined county boundaries and
additional counties for which population information are not available.
An overview of procedures used to develop ED maps and to geocode addresses in 1880 was published here: John R. Logan, Jason Jindrich, Hyoungjin Shin, and Weiwei Zhang. 2011. “Mapping America in 1880: The Urban Transition Historical GIS Project” Historical Methods 44(1): 49-60. For more information about how the mapping was done, use the following links for:
Data sources
Description of enumeration districts in 1880
Mapping procedures in cities where ED descriptions were preserved
Mapping procedures in cities where ED boundaries had to be reconstructed
The 1880 maps and data can be freely downloaded and used for research purposes. See the download page.
Several research articles have been mainly based on these data. Following is a list of studies involving project participants at Brown University:
John R. Logan and Hyoung-jin Shin. 2016. “Birds of a Feather: Social Bases of Neighborhood Formation in Newark, 1880” Demography 53: 1085-1108.
Hongwei Xu, John R. Logan, and Susan Short. 2014. "Integrating Space with Place in Health Research: A Multilevel Spatial Investigation Using Child Mortality in 1880 Newark, New Jersey" Demography, 51(3): 811-834.
Seth Spielman and John R. Logan. 2013. "Using High-Resolution Population Data to Identify Neighborhoods and Establish Their Boundaries" Annals of the Association of American Geographers 103 (1): 67-84.
John R. Logan and Hyoung-jin Shin. 2012. “Immigrant Incorporation in American Cities: Contextual Determinants of Irish, German and British Intermarriage in 1880” International Migration Review 46 (3): 710-39.
John R. Logan and Hyoung-jin Shin. 2012. “Assimilation by the Third Generation? Marital Choices of White Ethnics at the Dawn of the Twentieth Century” Social Science Research 41 (5): 1116-1125.
John R. Logan and Weiwei Zhang. 2012. “White Ethnic Residential Segregation in Historical Perspective: U.S. Cities in 1880” Social Science Research 41 (5): 1292-1306.
Antonio Paez, Manuel Ruiz, Fernando López, and John R. Logan. 2012. “Measuring Ethnic Clustering and Exposure with the Q statistic: An Exploratory Analysis of Irish, Germans, and Yankees in 1880 Newark” Annals of the Association of American Geographers, 102 (1) 84-102
John R. Logan, Seth Spielman, Hongwei Xu, and Philip N. Klein. 2011. “Identifying and Bounding Ethnic Neighborhoods” Urban Geography 32, 3:334-59.