
America’s Urban Transition
The Urban Transition Historical GIS Project is directed by John Logan, Professor of Sociology at Brown University. It uses historical census data to document the state of U.S. cities from the end of the 19th Century into the early 20th Century. These were the decades of America’s urban transition, fed by rapid growth of industry and large scale immigration from Eastern and Southern Europe that was directed primarily into cities. In 1880 nearly half of total employment was in agriculture, but this share dropped to about 25% by 1920, and by this time about half of the population lived in urban areas.
"Within the span of a few decades from the late 19th to the early 20th century, the United States was transformed from a predominately rural agrarian society to an industrial economy centered in large metropolitan cities … The decades surrounding 1900 were not only the age of industrialization in the United States, but were also the age of urbanization and immigration. The 1880s were the first decade in American history, with the exception of the Civil War decade, when the urban population increased more than the rural population (in absolute numbers)." Charles Hirschman and Elizabeth Mogford (2009) “Immigration and the American industrial revolution from 1880 to 1920” Social Science Research 38:897-920.
This webpage is a first step toward wider dissemination of research materials from the project. It establishes a baseline for studies of urban growth, spatial structure, and the incorporation of new groups of immigrants and minorities into cities in this period. It takes advantage of a unique data resource, the full transcription of the 1880 Census of Population created by the Church of Jesus Christ of Latter-day Saints and made widely accessible through the North Atlantic Population Project at the Minnesota Population Center.
As the population density map shows, in 1880 the American population was very heavily concentrated on the Northeastern Seaboard. But there were already patches of dense settlement in the Midwest, and the growth of cities like Chicago and Cleveland was already reshaping the urban hierarchy.
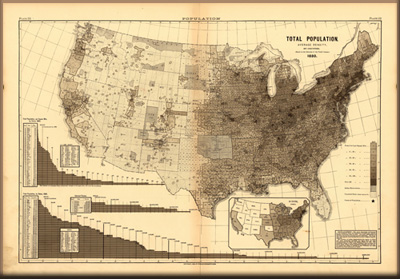
Population map of the U.S. in 1880, showing the density of settlement by county across the country.
Click on this map for higher resolution.
With support from National Science Foundation and National Institutes of Health, Dr. Logan and his research team have selected 39 major cities for intensive analysis. In the first phase, GIS maps were created for these cities, marking the boundaries of enumeration districts (EDs) that were used in the 1880 census and aggregating records from individual residents to provide summary information about the people who lived in each ED. Thematic maps have been created for each city showing characteristics like percent immigrant and average occupational status. These maps can be viewed using a web browser (the Web-Based Map tab on this page) [add link from here also]. This feature allows users to examine city neighborhoods in detail. The underlying data base of ED characteristics can be downloaded for analysis and for users who are proficient with mapping software the boundary files can also be downloaded.
In addition, the web-based GIS system also offers the same information for all counties covered by 1880 Census, developed by aggregating individual data for all residents of each county and using a map boundary file made available by the National Historical GIS Project.
Users are encouraged to review the technical documentation for the 1880 maps by clicking here – this material explains the data sources and how maps were created, and it identifies possible sources of error.