To help you successfully navigate our MAP Hurricane Katrina pages we offer an audio-visual tutorial explaining the application's tools and their function. Please select a specific function or tool that you are interested in from the list below:
If you need further help with using a tool while in the application, click on the tool bar to view our tutorial for a specific tool.
1 . Application Features
back to top
Click here to download or print our Help Notes which include an explanation of the Application Features and Navigation Tools as well as a Frequently Asked Questions section. If you need additional help in navigating the site please contact us at 401-863-6323.
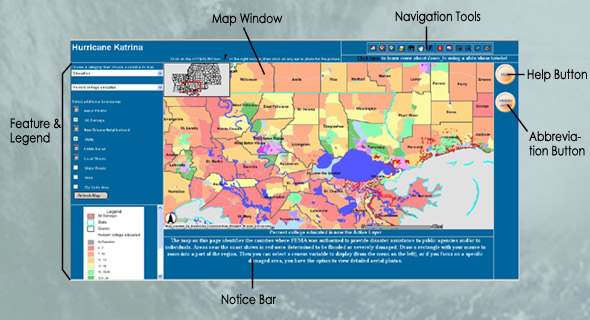
Map Window
The Map Window displays the primary map and a smaller overview map at the upper left corner of your screen giving you a broader view of the geographic region displayed in the large Map Window and helps you understand 'where you are' in relation to the state as a whole. See Map below.
Notice Bar
Also at the bottom of the map is text explaining what level data is displayed and what variables can be accessed from the map.
Feature & Legend
The legend found on the left of the Map Window in a white box explains the mapping features visible on the Map such as county or town boundaries (see Map above).
Once you choose a category and a variable the legend displays the ranges for each attribute as seen in the example below. In this case, Race and Ethnicity has been selected as the category and the variable chosen is Percent Black. Looking at the legend, you notice a color code for the range of this variable, Percent Black. For example, the top pink color represents those towns on the map selected with populations that are 0-1 percent Black. we used even distribution methold for 10 category in each map legend.
Select additional Boundaries:
If you want to see the additional boundaries such as zip code boundaries, city/town/village/CDP boundaries, county, MSA, state or local streets and major roads on the map selected, click on the white box before the item you want to see on the right hand side of the Map Window under the Choose a Variable drop down menu.
Check these boxes and then click the Refresh Map button. The additional boundaries will appear on the map in the Map Window.
back to top
2 .Navigation & Tools

Located at the top of the Map window, these tools, represented by icons, help you navigate the map. Most of the tools are self-explanatory - similar to those used in other PC software - such as zoom in (  ), zoom out
  ), pan (
  ), print (
  ) and clear (
  ). Others are specific to this application and other GIS systems.
Also, if you rest your mouse cursor over the icon on the tool bar, a brief definition appears explaining its use. If you click the tool, a notice appears just below it giving you the option of learning more about this tool in our flash tutorial.
Abbreviation Button
To find the key to the abbreviations for the categories, variables or indicators used in the Map Application click on the Abbreviation button at the upper right hand side of the Map Window - right under the Help button.
Some abbreviations are listed even though they only appear in the Query Tool function. For example, if you choose 'total population' from the variable field in a Query it is abbreviated as TOT_POP. However once it is selected it appear as TO_POP in the Add to Query String field.
Overview Map Toggle
Moving from left to right the first icon (  ) on the tool bar is the Map Overview Toggle option. This allows you to choose whether or not to display the overview map in the upper left hand corner of the Map Window. Clicking on this icon would remove the overview map from your browser. To bring it back, just click it again. The overview map gives a bird's eye view of where you are in relation to the state or region displayed in the Map Window.
Zoom In
The second tool on the bar is used to magnify or Zoom In on the area of interest. Use this tool ( ) when you want to view a smaller area in more detail. Click the Zoom In tool once and then click on the area of interest on the map. This will enlarge the area by a factor of 2 and you can keep clicking till you get the detail you desire. During this process some of the layers disappear while new layers appear. For example, the first click may show you the data and boundaries for towns and cities, and the second click may reveal data at the level of census tracts.
back to top
Zoom Out
Moving along you will find the Zoom Out tool ( ) which allows you to view a larger area in less detail. Click the Zoom Out tool and click the area that you want to view from a larger perspective. It re-centers the map (once you click) and reduces the area by a factor of 2.
Pan
In the middle of the tool bar is the Pan tool ( ) which allows you to browse around the map without using the zoom in and zoom out tools- moving the viewable area of the map (left, right, up, down). Click on the Pan icon on the tool bar and move your mouse to the desired area of the map, hold and wait for the new map to load.
HyperLink
Click on the HYPERLINK tool(  ), then click on any nursing home for information about that home.
Identify Visible Features
Moving to the right you'll find the Identify tool used to view the statistical data for the visible geographic region. The map itself shows you data in categories; the Identify tool lets you see the exact numbers for any census tract, town and county visible on the map viewed in a pop up table. Click once on this tool and then click on any spot on the map. A new window appears showing information about all the layers of geography for the spot you clicked on.
back to top
Clear Tool
After you have used the Identify tool to view information, you must use the Clear Selection tool ( ), second from the right of the tool bar, to erase the geography selected in this process. You must also use the Clear tool after using the Select by rectangle, Select by Polygon and Query tools. Using this eraser wipes the Map Window clean of the last selection allowing you to start on a new query or selection.
Query
When you click on this tool (  ) you open a Query box just below the map at the bottom of your Map Window screen. The query tool can help you find or identify tracts that meet specific criteria within the category you have selected.
Here you see three white boxes labeled Variable , Operator and Value .
The best way to explain this tool is to use an example. Let's say we want to know the number and location of census tracts that have a total population over 800 . Looking at the Query box at the bottom of your Map Window screen, find the first box labeled Variable. Click on it and select the variable we are looking for from the drop down menu which, in this case, is Total Population abbreviated as TOT_POP in the variable menu (or as TO_POP when it appears in the Add to Query String box).
If you need help understanding the abbreviations click on the Abbreviations button on the right side of the Map Window under the HELP button and scroll down the list which is organized by category, abbreviation - both in the variable menu and as it appears on the Query String box- and definition.
Moving to the next box, labeled Operator , the math expression or function needed for your query, and select the greater than symbol (>) from the drop down menu. Then using our example, enter 800 in the next box labeled Value .
If we were unsure of an appropriate value for our question, we could just click on the Get Sample box and choose from the drop down menu revealing the typical range of data values for the Variable we choose, giving us a sense of what is a high or low or average value.
To find our results, click on Add to Query String and then Execute .
The result of our query pops up in a table in a new window. The areas matching your query are highlighted on the map in bright yellow.
Your question or inquiry can involve more than one Variable or Value . For example, if we wanted to look at the number and location of census tracts that have a total population over 800 "and" less than 2000.
You would repeat the step above - selecting Total Population abbreviated as TOT_POP as our Variable , selecting the greater than symbol (>) from the drop down menu under Operator and entering 800 in the next box labeled Value .
We now click on Add to Query String AND then click on the appropriate function on the right of your screen such as and, or, not etc. In this case it would be "and".
Now we keep the same data in the Variable and Total Population fields and move to the Operator box to enter the less than sign (<) and to the Value box to enter 2000.
Since this finishes our query we can click on the Execute box for our final result. Once you click on Execute a table pops up listing the data that meets our inquiry - in this case total population over 800 "and" less than 2000.
Do not click Execute until all information is entered and you are ready for your final result.
Reading the Table.
To read the Query table or any table in the application, start from left to right, the first column is labeled Rec (or record) which refers to the number of each census tract that matches your query.
Clicking on the blue numbers (underlined to indicate a link) in Rec column identifies the geography corresponding to that tract(s) meeting your criteria. These are highlighted in bright yellow on the map.
The table has several columns with abbreviated headings such as County, Total Population (TOTAL_POP), area in square miles (AREASQMI), % black, % Hispanic, % Asian, % Native American (NATIVEAM), and % Minority etc.
If you need help understanding these abbreviations, click on the Abbreviations button on the right side of the Map Window under the HELP button.
REMEMBER you must close the Map Window to map another variable.
Download Data You can download the data in two ways: 1) by performing a query or 2) by "identifying" the data and copy/pasting the results (revealed in a pop up window) in an excel spreadsheet.
back to top
Select by Rectangle
This tool (  ) allows you to select a particular area/region for census tract, town or county of interest and reveal only the data associated with it.
This tool uses a red rectangle to mark your selection - all areas within the rectangle and all the areas it touches are selected. Click this tool and draw a rectangle around the region or geography you are interested in. Give this application some time to load, and then your selected area appears highlighted in yellow. Also a pop up window appears, showing the data for geographic units in this area.
As in the Query function, click on the blue numbers in the left-most column of this pop up window labeled Rec and zoom to the corresponding location in the map window. After you have used this tool to identify information, you must use the Clear Selection tool to get rid of or erase the geography selected in this process.
Select by Polygon
This tool (  ) allows you more specificity when selecting a region or geography by drawing an irregular polygon to include areas of interest. With a little practice you can draw a polygon that includes any set of adjacent areas that you wish to see information for. Then follow the same directions (see above) for Select by Rectangle. After you have used this tool to identify the layers of information, you must use the Clear Selection tool to get rid of or erase the geography selected in this process.
Print
By clicking on the last icon, the print tool ( ) you can print the map as it appears in the Map Window along with a specific title. When you click on this tool a window appears at the bottom of the Map Window. Use the scroll bars on the right to allow you to allow you to fully view this window.
You can give your map a title by typing it into the field labeled, "Type the title here".
Then click on 'Create Print page' to open a new browser window similar to a print preview one showing the map, Overview Map, and Legend. You can then use the File/Print menu item to send the page to your printer.
To copy and paste data into a spreadsheet, highlight everything in the table, right click your mouse and select copy. Open up Excel, and paste the data into a spreadsheet. Once you've completed this, you can review the various characteristics of these tracts in the spreadsheet. You could save this spreadsheet or import it into another program for further analysis.
3. Frequently Asked Questions (FAQs)
Q1: What is a web-based GIS?
A Web-Based GIS (Geographic Information Systems) is an Internet-based tool that allows you to display, query and understand spatial data in an easy-to-use browser application that does not require any GIS software.
Q2: What information can I get from this application?
We have selected some key social and economic indicators that offer important information about counties and towns/census tracts. These include many from the U.S. Census: population characteristics such as population density, population growth, racial composition, and age; economic indicators including median household income, poverty and public assistance rates, and education; and housing information such as median rent, house value, and homeownership. At the county level there are additional indicators from non-census sources.
Q3: How do I browse the website?
It is highly recommended that you start by reading our HELP page which gives you an overall idea of how to browse the map application, how to explain and interpret the map and data available. Also be sure to review the Navigation Tools section as well. While some of the tools may be familiar to you, some are very specific to GIS applications.
Q4: What do the icons in the toolbar mean?
See the explanation in the ' Navigation Tools ' section.
Q5: How do I use the application to ask specific data questions? See the description for our Query tool in the Navigation Tools ' section.
Q6: What are the definitions of the variables and how do I decide which ones to look at?
Brief descriptions of the variables that you can map on this system are provided on the Variable Description page. To properly interpret the data you need to understand exactly what information is being provided as it relates to the question you are trying to answer.
For example, let's say you are interested in knowing how the local economy is doing in a particular set of census tracts. The first thing you might consider is what Economic Indicators do we use in this mapping application? What variables and their corresponding data did we look at to paint this economic picture? With a visit to the Variable Description Page you can review the Economic category and find the variables used, and generally considered relevant to how healthy an economy is, such as rates of unemployment, college-educated population, and public assistance.
Q7: How can I print the map?
See the " How to print a map " section.
Q8: Can I save this map?
Yes! You can save the map by right clicking on the Map Window and selecting 'save picture as'. You can also give the map a title and arrange it for printing.
Q9: Can I download the data?
Yes! You can download the data in two ways - by performing a query or by "identifying" the data and copy/pasting the results (revealed in a pop up window) in an excel spreadsheet.
