Census geography: Bridging data from prior years to the 2010 tract boundaries>>
MapUSA: Global Neighborhood variables for 1980-2010
The LTDB map and data downloads now include variables that describe the combinations of racial/ethnic groups living in a tract in each year 1980-2010. The specific nature of increasing diversity in neighborhoods in this period has been documented in studies by John Logan and Wenquan Zhang, showing that in most metropolitan areas there has been a substantial decline in all-white neighborhoods, a concomitant rise in global neighborhoods that include whites, blacks, Hispanics, and Asians, and persistence (and sometimes growth) of all-minority neighborhoods at the same time. See:
- John R. Logan and Charles Zhang. 2010. Global Neighborhoods: New Pathways to Diversity and Separation American Journal of Sociology, 115 (4): 1069-1109
- Wenquan Zhang and John R. Logan. 2016. "Global Neighborhoods: Beyond the Multiethnic Metropolis" Demography 53: 1933-1953, on line DOI 10.1007/s13524-016-0516-4
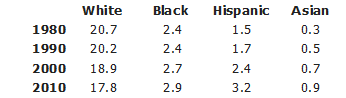
Combinations of groups are presented in the LTDB at two scales. A simple four-category scheme is used at the county level, describing counties as white, white/black (with few Hispanics or Asians), immigrant minority (white plus Hispanic or Asian but few blacks), or multiethnic (all groups well represented). The categories depend on identifying which major groups are present above some minimal level in the tract. The minimum levels used as cutoff points vary from decade to decade, reflecting the changing overall composition of the country. They are set at values equal to one-quarter of the (unweighted) average share of the group in the multiethnic metropolitan areas studied in Logan and Zhang (2010). These values are:
At the tract level, the LTDB adopts the cutoff points and categories used in Zhang and Logan (2016). There are two levels of combinations, labeled Diversity general and Diversity detailed. These are displayed in the following chart, where a groups presence is shown as W (non-Hispanic white), B (non-Hispanic black), H (Hispanic), and A (Asian). For example, the general category of minority neighborhoods includes neighborhoods with all detailed combinations of blacks, Hispanics, and Asians but without a white presence.