Exploring Survival on the Titanic
Welcome to the final coding challenge! This comprehensive project requires you to apply and combine many methods which we have learned. If a method is not introduced in our tutorial, a short description of the methods to use is shown, which you could use Python's help() or Ipython's ? to bring out the help documentation of the function to use.
The Case
The sinking of the Titanic is one of the most infamous shipwrecks in history. On April 15, 1912, during her maiden voyage, the widely considered “unsinkable” RMS Titanic sank after colliding with an iceberg. Unfortunately, there weren’t enough lifeboats for everyone onboard, resulting in the death of 1502 out of 2224 passengers and crew.
While there was some element of luck involved in surviving, it seems some groups of people were more likely to survive than others.
The ultimate goal of this challenge is to build up a predictive model that answers this question: "what sorts of people are more likely to survive" by looking at the characteristics of passengers.
As it's your first day in the data science track, instead of building up a classification model, we would analyze the data and answer that question in an exploratory way.
Data
The data has been split into two parts. You will be asked to merge them together.
- part1.csv
- part2. csv
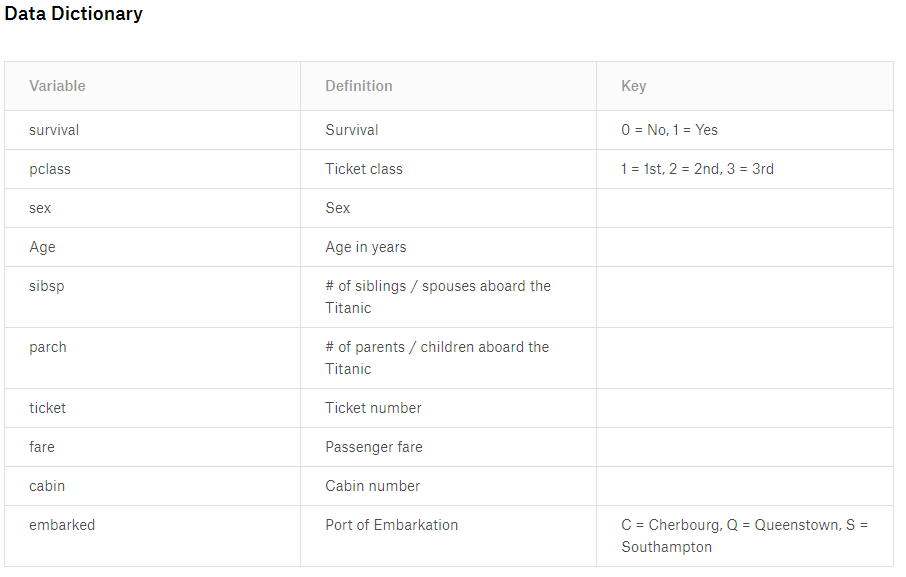
Data Dictionary
Workflow of Exploratory Data Analysis
- load the data
- Explore the data
- Wrangle, prepare and cleanse the data.
- Analyze, visualize and identify patterns.
Fun time
Import packages
Hint: pandas and numpy.
import pandas as pd
import numpy as np
Load the two datasets
Hint: read_csv()
df1 = pd.read_csv("part1.csv")
df2 = pd.read_csv("part2.csv")
Append the dataset2 to the dataset 1
Hint: .append()
df = df1.append(df2)
Explore Data
- get the column names of the data
- get the shape info of the data
- preview the data,looking at the first 10 rows
- which variables/columns are purely numerical? which columns are string types?
- which columns have missing values? and the number of missings?
- get the descriptive statistics of the numerical variables?
- get the descriptive statistics of the nominal/categorical variables?
- Make a boxplot of the variable Age
- get to know how many passengers died and how many survived by looking at the Survival column
#get the column names of the new dataset
df.columns
# get the shape info of the new dataset
df.shape
#preview the dataset, looking at the first 10 rows
df.head(10)
#which varialbes are numerical? which variables have strings?
df.dtypes
#which columns have missing values?
#and how many values are missing from those columns?
df.isnull().sum()
#The descriptive statistics of those numerical variables/columns?
#specifically we want to know the mean, std, min, max and percentiles.
#Hint: describe()
df.describe()
#The descriptive statistics of the categorical varialbes?
#e.g., count, unique, top, frequency
#Hint: .describe(include=np.object)
#Link to the help documentation of the describe function
# https://pandas.pydata.org/pandas-docs/stable/reference/api/pandas.DataFrame.describe.html
df.describe(include=np.object)
#Plotting the age varialbe using boxplot
#Hint:.plot(y='Age', kind='box')
# if the diagram is not shown, please do the following in a new cell
import matplotlib
%matplotlib inline
df.plot(y='Age',kind='box')

# Plot the survived varialbe using bar chart
# Hint: value_counts()
df.Survived.value_counts()
Drop columns
Drop the Cabin column as it has too many missings and it has nothing to do with the classification model.
Hint: .drop()
df.drop(columns=['Cabin'],inplace=True)
Impute missing values
- for numerical variables: use the median Age->median Hint:df.Age.fillna()
- for nominal/categorical variables: use the most frequent category. Embarked->most frequent port Hint: df.Embarked.fillna()
#impute the missings of the Age column
df.Age.fillna(value=df.Age.median(), inplace=True)
#impute the missings of the Embarked column
###Hint: How to get the most frequent value of the Embarked
#Hint: df.Embarked.mode()[0]
#or df.Embarked.value_counts.index[0]
most_fre = df.Embarked.mode()[0]
df.Embarked.fillna(value=most_fre, inplace=True)
#check if all the missing values are gone
df.isnull().sum()
Analyze the data
- get the survival rates by gender (Hypothesis: Were women more likely to survive?)
- get the survival rates by ticket class (hypothesis: did rich people have a higher chance to survive?)
- get the survival rates by both gender and ticket class
- What is the survial rate of Rose? What is the survival rate of Jack?
#use groupby method to calcuate the means of survival column
#calcuate the survival rate by Sex
df.groupby(by='Sex')['Survived'].mean()
#calcuate the survival rate by pclass group
df.groupby(by='Pclass')['Survived'].mean()
#calcaute the survival rate by both pclass and sex
df.groupby(by=['Sex', 'Pclass'])['Survived'].mean()
#What is the survival rate of Rose? How about Jack?
Rose: 96.80%, Jack: 13.54%