Rhode Island and COVID-19
Tracing the Pandemic
Kevin Mwenda PhD1,4
Guixing Wei PhD1,4
Juanfang Lei1
Diana Grigsby-Toussaint PhD, MPH1,2,6.7
Laura Lopez-Sanders PhD4,5
Patrick Vivier MD, PhD1,3
Michael White, PhD1,4,5

The S4 Working group on COVID-19,
Spatial Structures in the Social Sciences
Brown University
2 September 2020
spatial_structures@brown.edu
1.Spatial Structures in the Social Sciences, Brown University
2.Department of Behavioral and Social Sciences, Brown University School of Public Health
3.Hassenfeld Child Health Innovation Institute, Brown University
4.Population Studies and Training Center, Brown University
5.Department of Sociology, Brown University
6.Department of Epidemiology, Brown University School of Public Health
7.Center for Health Promotion and Health Equity, Brown University School of Public Health
Acknowledgments: We appreciate advice and comments received from John Logan, Elizabeth Fussell, R.A. Whitfield, and Sasha Raman. We are also thankful for the review and comments offered by members of the Rhode Island Department of Health staff, Blythe Berger, Michael Byrns, and Philip Chan.
>>>> Download the PDF file of this report <<<<Introduction and Overview
As of August 19, 2020, more than five million cases of COVID-19 have been identified in the US, with 20,795 cases reported in Rhode Island. Although Rhode Island has responded energetically to the COVID-19 pandemic, there is still much concern about a resurgence of infections and the mortality and economic consequences that are to follow. While the pandemic has affected people from all walks of life, both the illness itself and its subsequent economic effects have been felt differentially across residential communities and demographic groups. In this short report, we provide some analysis and graphical display of the recent COVID-19 situation in Rhode Island.
We hope that this information can help public health officials and others engaged in planning the COVID-19 response, gain additional insight into where we have been and who has been impacted. We intend for this brief to facilitate plans for policy adjustment in upcoming months, as Rhode Island seeks to keep its residents healthy and its economy on the road to recovery. Our major topical areas and findings are as follows:
- Spatial Distribution of COVID-19 cases across Rhode Island residential communities: We confirm that COVID-19 cases are concentrated in a handful of communities, which have a high proportion of racial and ethnic minority groups, as well as persons in poverty. We also show that there have been slight changes to the spatial concentration of cases.
- Geographic Mobility. We trace the relative geographic position of Rhode Islanders and observe time spent (total visitors) in key types of locations compared to the average US State. We find that Rhode Islanders exhibited a dramatic increase in time spent at home in the early days of the pandemic. This increase in time at home was initially larger than elsewhere in the US, but the pattern eventually merged with the US overall. Following the initial decline, Rhode Islanders have made fewer visits to workplaces than the US average.
- Household Outcomes. Drawing on the nationwide US Census Bureau Household Pulse survey, we find that (a) an increasing proportion of households reported a loss of employment income between March and July, matching national trends; and (b) an increasing share of RI households report food scarcity as the pandemic proceeded into July.
- Demographic Groups. Tabulations from the US Census Bureau’s 2018 American Community Survey for Rhode Island residents indicates that Black and Hispanic[1] persons are more likely to live in poverty, be immigrants, and live in higher density dwellings, all potential risk factors. As many as one-fifth of the Hispanic population indicates challenges in speaking English, a much higher proportion than other groups. Black and Hispanic persons are more likely to be employed in occupations that might be deemed to be at more risk for exposure to COVID-19, but the occupational categories differ somewhat between these two groups.
These descriptions of the overall features of the COVID-19 landscape in Rhode Island, should be interpreted with an awareness of the caveats of the source data and methods. We include an Appendix to this report that contains such information. We also present supplementary information—additional tables and maps—here, with more on our website.
Background
The global and national impact of the COVID-19 pandemic has been well documented (and continues to be updated) from many sources. Rhode Island’s circumstances, and its response, take place in this wider context. This context is not only the progress of the pandemic itself, but also a major reckoning in the United States with systemic racism, and a recognition of society’s institutional features that place certain individuals and their communities in positions of greater vulnerability.
In a July 5th article titled, “The Fullest Look Yet at the Racial Inequity of Coronavirus” the New York Times found that “Black and Latino people have been disproportionately affected by the coronavirus in a widespread manner that spans the country, throughout hundreds of counties in urban, suburban and rural areas, and across all age groups”.[2] The New York Times did not separately map RI county data, but Rhode Island’s Department of Health data do indicate that the share of COVID-19 cases among Hispanic persons (46%) and Blacks (12%) is above their proportion in the RI state population[3].
The spread of COVID-19 has been increasingly extensive even as it has been geographically uneven. As is well-known, several northeastern states, including Rhode Island and its neighbors (CT, MA, NY) were more heavily impacted early on.[4] By August 2nd , however, Dr. Deborah L. Birx, coronavirus coordinator, stated, “What we are seeing today is different from March and April — it is extraordinarily widespread.”[5]
Within the State of Rhode Island, governmental and public health leaders have expressed parallel concerns about the virus’ differential socioeconomic and ethnoracial impact, and its geographic disparities. The RI Department of Health, and its director, Dr. Nicole Alexander-Scott, have shown much concern for both geographic and ethnoracial disparities with COVID-19, pointing out that: “people in certain ZIP codes are getting COVID-19 at higher rates” and that “Latino Rhode Islanders and African American Rhode Islanders are being hit the hardest by COVID-19.” [6] Even before the pandemic, the Department’s Health Equity Zones were already an attempt to address some of these combined social and geographic disparities.[7] Furthermore, the month of July exhibited an uptick in COVID-19 cases, as depicted in Figure 1. This, in turn, has led to a “pause” in the recovery plan being pursued by Governor Gina Raimondo and has prompted expressions of concern from public health and medical authorities. [8]
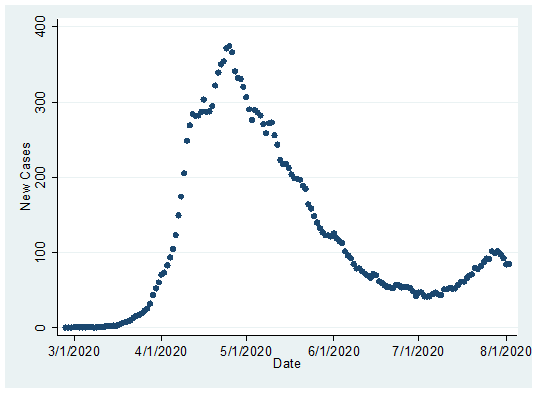
Figure 1. COVID-19 cases, 7-day moving average tabulated from RI DOH
data.
Source: RI Department of Health COVID-19 Data Hub
Spatial Distribution of COVID-19 in Rhode Island, Equity Impacts
These cases, were, of course, not evenly distributed across the cities and towns of the state. The rate of
COVID-19 cases was associated with the ethnoracial and socioeconomic composition of communities, reflecting the
concerns raised by Rhode Island health and governmental leaders. Figure 2 displays the COVID-19
case rate for
municipalities along with an indication of the municipality’s share of population that is Hispanic
(Figure 2a) or non-Hispanic Black (Figure 2b).
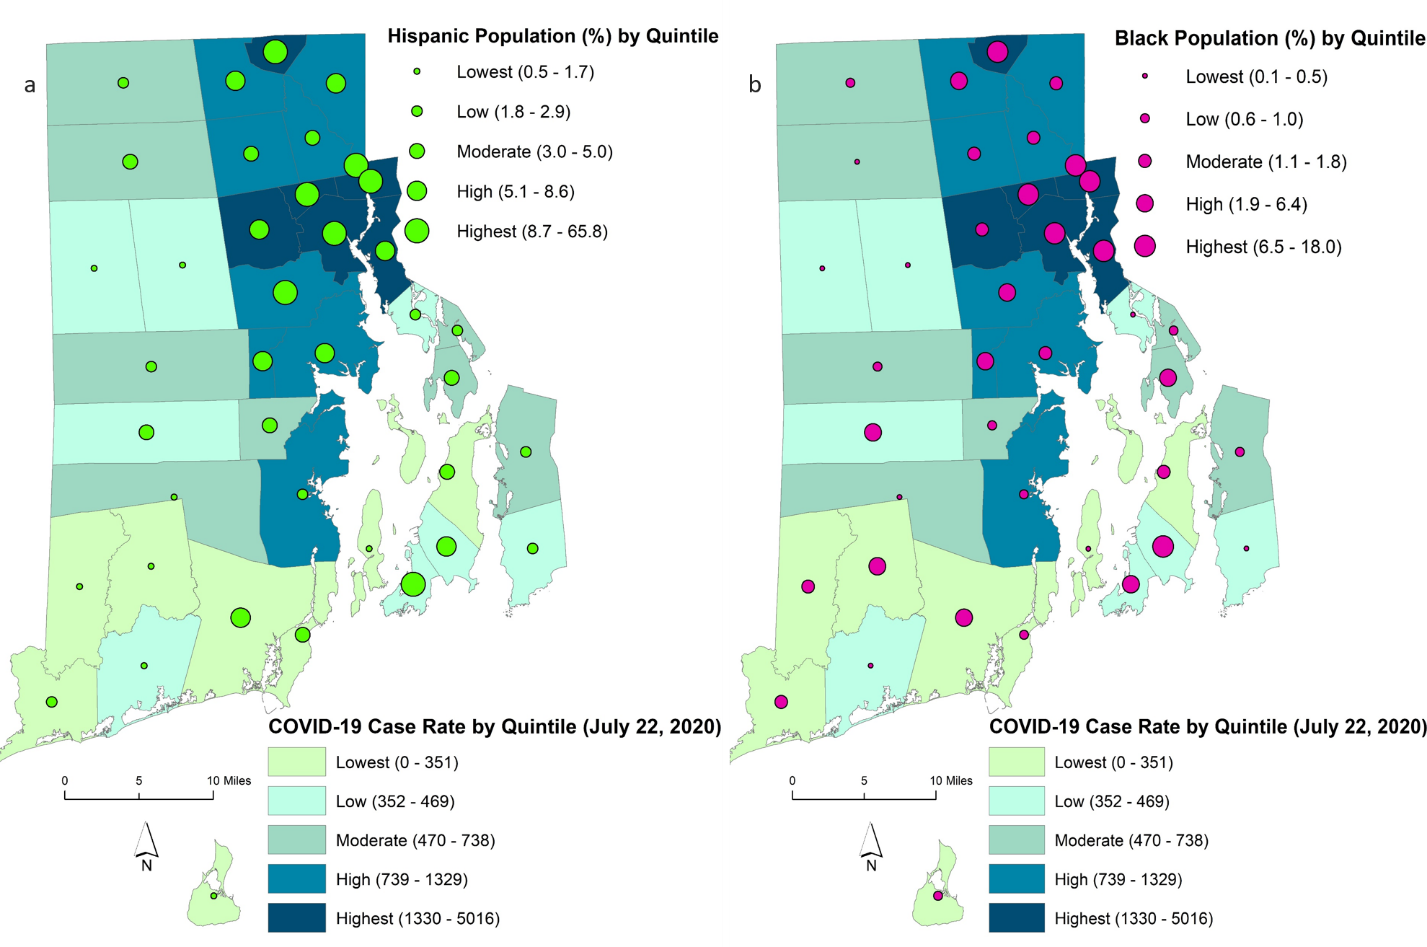
Figure 2. COVID-19 Cumulative Case Rate and Ethnoracial Composition of
Municipalities
Notes: Shading of city or town indicates rates of state-reported confirmed cases (per 100,000 population)
recorded through July 22, 2020). Shading is represented in quintiles, and is the same for maps (a) and (b).
Colored circles indicate the proportion of the municipality who population is Hispanic or Non-Hispanic Black, by
quintile.
Source: RIDOH COVID-19 Data (Data Download: 3 August 2020)
The share of state-reported cases was highest across municipalities that also had higher proportions of persons of color. This spatial concentration has remained roughly constant, even as the total number of new cases declined. In April, the case rate was correlated with the city/town percent Hispanic at 0.85 and the percent Black at 0.80.[9] These numbers changed very little by July (0.82, 0.82, respectively). The case rate is also highly correlated with the poverty rate across municipalities (April 0.78, July 0.72). These municipalities constitute urban core communities. In both April and July, Providence, Pawtucket and Cranston accounted for over half of the state’s cases, but only 31 percent of the population. By July, the leading eight locations (also including Warwick, Central Falls, North Providence, Johnston, and East Providence), which contain about half the state population, accounted for over two-thirds of cases.[10]
These are allocations by recorded geography of residence, and exposure could have occurred in another location, such as a school, workplace, or social gathering . The earlier months of the pandemic had a significant impact on the elderly population in Nursing Homes and Senior Living Communities.[11] We find that the relationship between elderly residential concentration and case rate is weaker and actually negative across the 39 municipalities (April -0.56, July -0.54), but this is partly due to the fact that residents in congregate settings are not included in the municipality tally.[12] It is also likely then that the settlement pattern of older residents, many of whom already reside in lower-density communities, and the mitigation measures practiced by older individuals served to weaken this correlation.
Supplementary maps displaying the COVID-19 confirmed cases (counts), along with selected population characteristics in RI cities & towns are available in the Supplementary Material and on the S4 website.
COVID-19 and Geographic Mobility over Time
Workplaces. Figure 3 presents the trend in Google Community Mobility data for places classified as workplaces. The data arise from anonymous signals from personal devices, e.g. smartphones with location information enabled. This provides information on where the device is over time. Larger values on the Y-axis mean more growth in terms of total visitors compared to the baseline for that type of place. (See appendix for more details.) The figure presents the trend for Rhode Island, and for comparison purposes, the median value across US states, from the baseline (pre-pandemic) reference period through July. After RI Governor Gina Raimondo declared a state of emergency on March 9th, with further announcements building to a March 28th stay-at-home order[13], the workplace activities in RI dropped rapidly to 52% below the baseline level by April 9th. The workplace activities started gaining a gradual increase afterwards. The trend line for the median value of other states shows a similar pattern. For most of the March to July period, however, RI has exhibited lower levels of mobility compared to the median value of all other states, which is likely to reflect both the greater impact of the pandemic in Rhode Island and a substantial level of compliance among RI residents for staying at home and/or working remotely.[14]
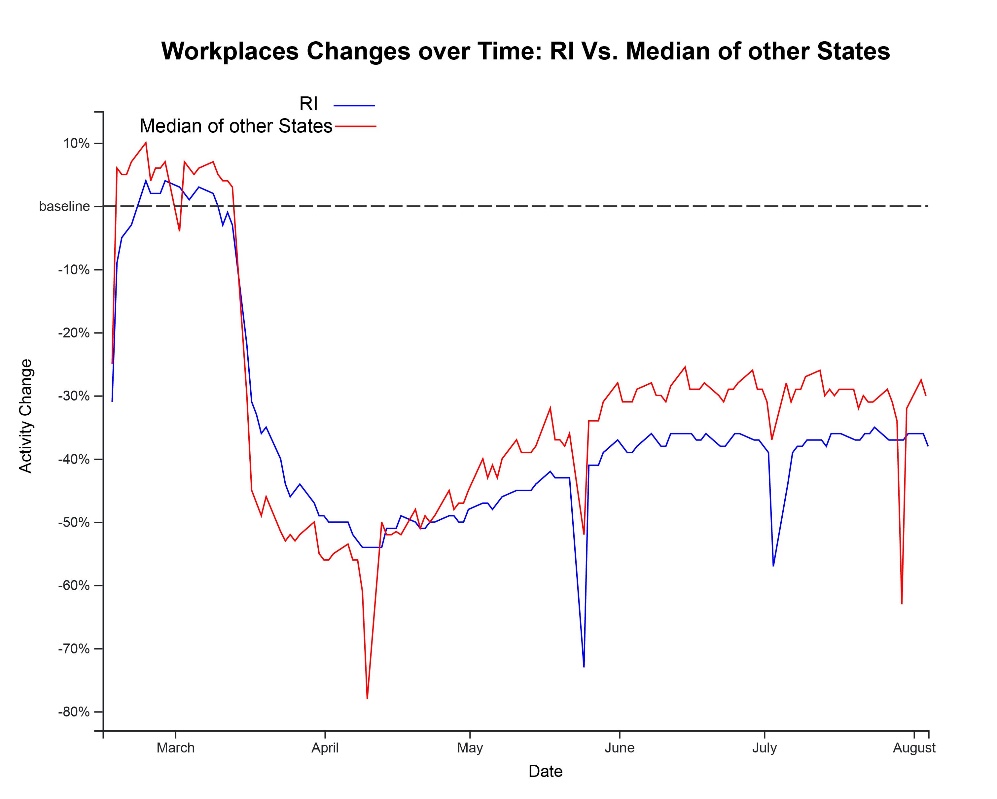
Figure 3. Workplace changes over time between RI and Other States.
Note: The percentage change is a relative measure compared to its baseline value for that day of the week with respect to the number of visitors to workplaces. The baseline value is the median value from 5-week period Jan 3 – Feb 6, 2020.
Residences. The residential trend graph from the Google Community Mobility data in Figure 4 delivers a message complementary to that from the workplace graph. The larger the value on the Y-axis the more time spent in a residential setting compared to the baseline (pre-pandemic) reference period. That is, after the announcement of state emergency, RI residents started spending more time at home than they used to prior to the COVID-19 pandemic. This restricted behavior has been weakening since mid-April, which suggests that people started leaving their residences. Compared to the level prior to the pandemic, RI residents still spend 10% more time at home. The difference between RI and other states through the April-May period suggests that RI residents shifted their time more towards home than residents of the median state. This is consistent with the interpretation that overall, RI residents have been doing a good job adhering to restrictions.
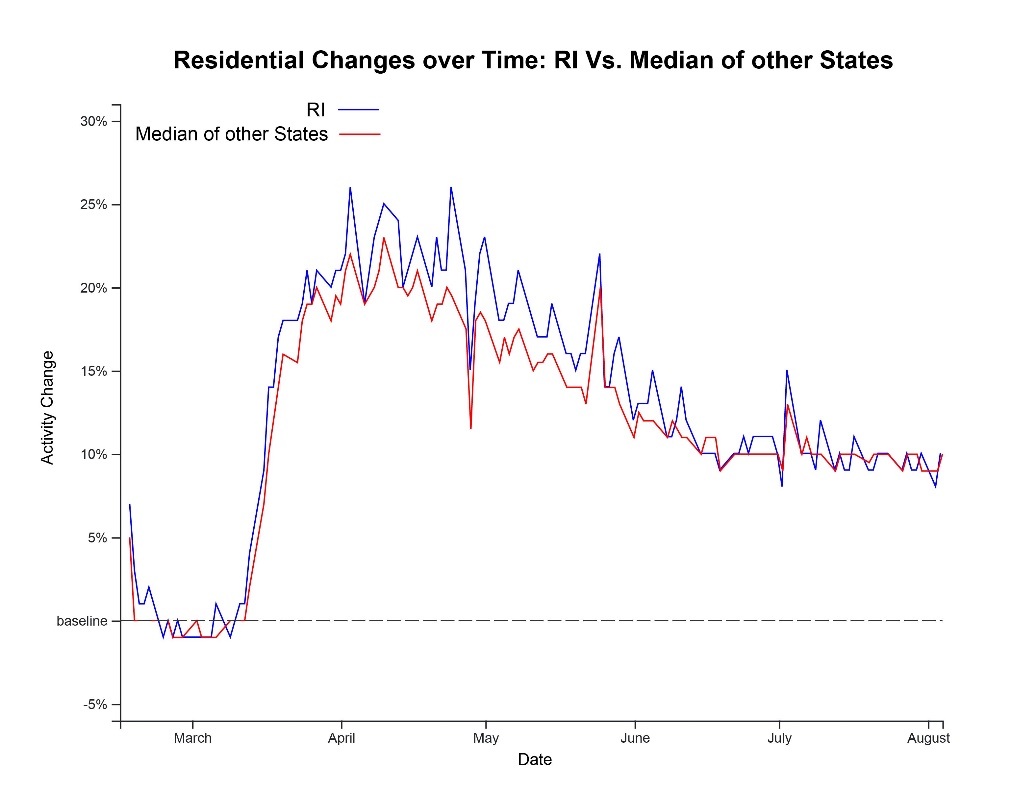
Figure 4. Residential changes over time between RI and Other States
Note: The percentage change is a relative measure compared to its baseline value for that day of the week with respect to the duration people spend at residential places. The baseline is the median value from 5-week period Jan 3 – Feb 6, 2020. Larger values in the figure indicate more time in a residence.
Parks. We have also traced the Google Mobility indicators for places classified as Parks, respectively. Such a classification by Google is likely to be less precise and also reflect a mix of activities. Figure 5 presents the trends for places classified by Google as parks in Rhode Island. This indicator is the only mobility measure that shows positive increases for most of the time. This indicator has a large degree of variation, both seasonal and day-to-day. The only conclusive message is that people have been using RI parks much more frequently than they used to prior to the pandemic. For example, Rhode Island park activities on August 3rd were recorded to be over three times that of baseline in Figure 5.[15]
Recall that since these are anonymous data generated from smartphone location indicators, we neither know the personal characteristics (age, sex, income), nor the actual residence (RI or other state) of those who generate these time trends.
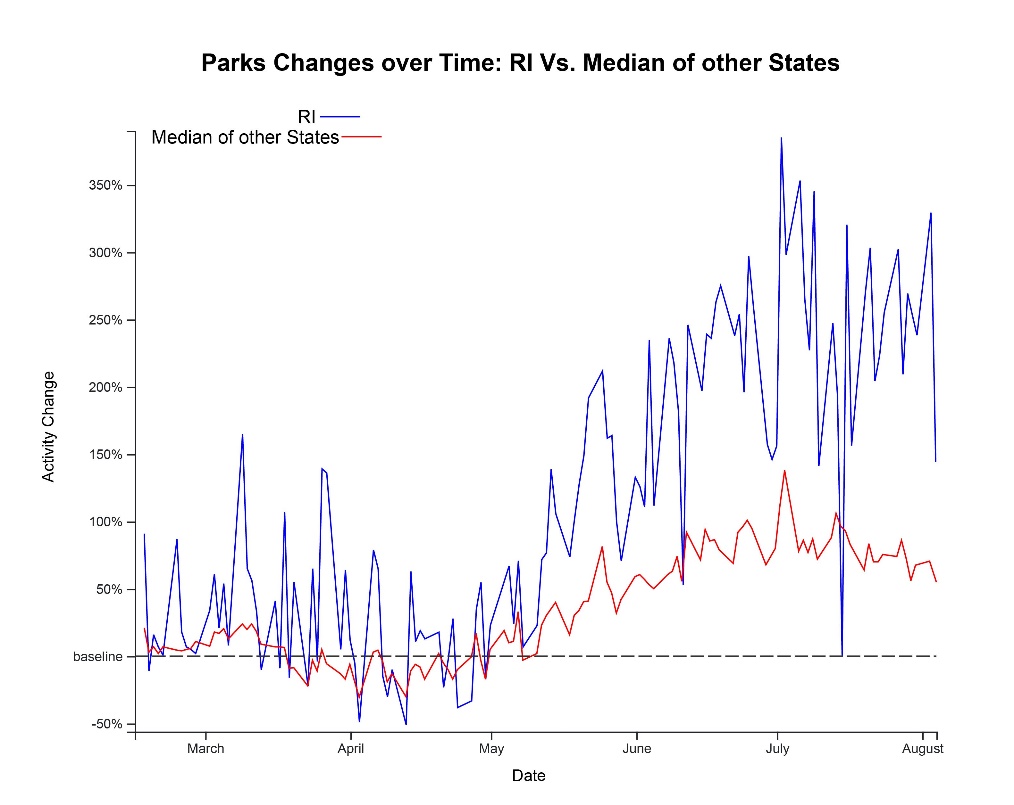
Figure 5. Park Use changes over time between RI and Other States
Notes: Parks includes several types of places but not general outdoors in rural areas (see methods notes.) The percentage change is a relative measure compared to its baseline value for that day of the week with respect to the number of visitors to parks. The baseline, the normal value is the median value from 5-week period Jan 3 – Feb 6, 2020.
Insights from the US Census Bureau Household Pulse Survey
Beginning in April and continuing through July, the US Census Bureau conducted a “pulse” [16] survey via direct digital means (internet, smartphone text) to gather rapid survey responses regarding the impact of the pandemic on employment and income, food security, and well-being among US households. We look at trends in job loss and food insecurity. We first present descriptive graphics for the 12-week time trend in responses the Household Pulse survey for Rhode Island, charted against the US as a whole and against the nearby states of Massachusetts, Connecticut, and New York, all also heavily affected by COVID-19.[17]
Employment Income Loss. The Pulse survey asks, “Have you, or has anyone in your household experienced a loss of employment income since March 13, 2020?” We graph the trend in the response for RI, the three adjacent states, and for the US overall. We note first that this is a report of the respondent about anyone in the household, not just a job income loss for the respondent alone. It also presumably includes affirmative responses from those who have seen hours (and thus overall income) cut in this time period. We mention only apparent trends; these Pulse Survey statistical estimates are often not precise enough to assert differences across geographic units.
Figure 6 shows a steady increase in Pulse respondents nationally (red) reporting a household employment income loss, rising to a majority of respondent reports by week 12, tracking an increasing severity of the pandemic. All of the individual states we looked at closely, including RI, showed similar increases in the reports of income losses.
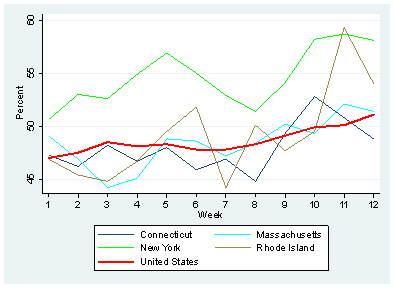
Figure 6. Reported Loss of Household Employment Income
Source: US Census Bureau. Pulse Survey (Tabulated Data Download: 2 August 2020)
Measure Definition: Percentage of adults in households where someone had a loss in employment income since March
13, 2020.
Food Scarcity. Pulse tabulations in Figure 7 show a gradual uptick in food insecurity nationwide in the most recent few weeks (red). The four individual states in the Northeast display somewhat differing levels and trends, but these are measured with much less statistical precision. New York and Connecticut mostly track with the US value, until NY diverges in the last week. Massachusetts displays lower (than US, NY, CT) and declining food insecurity for the first several weeks, with a net upturn for the final few weeks. The path for Rhode Island traces below the national average through the middle of the period during which it declined on balance, but following week 6 (June 4-9), Rhode Island respondents have been increasingly likely to report that there was insufficient food for the household during the prior week.
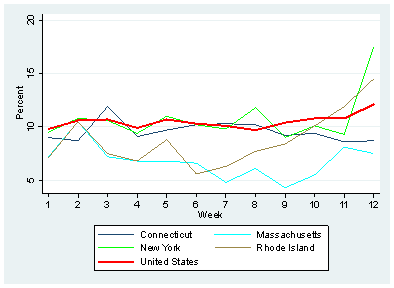
Figure 7. Reported Household Food Scarcity
Source: US Census Bureau. Pulse
Survey (Tabulated Data Download 2 August 2020)
Measure Definition: Percentage of adults in households where there was either sometimes or often not enough to
eat in the last 7 days.
Social and Demographic Characteristics of the Rhode Island Population
Rhode Island is a diverse state, with large populations of persons of color, many immigrants, and a variety of socioeconomic and housing conditions. As the comments of the Department of Health Director and others indicate, and as the first section of this report demonstrates, the burden of COVID-19 cases and fatalities has not been an even one, with the Black and Hispanic populations[18] particularly affected by cases and the elderly (and those with underlying conditions) at much higher risk of death. As Rhode Island continues to respond to the pandemic crisis, and as the state must prepare for the possible spread from other regions where COVID-19 is now more prevalent, it is valuable to revisit some key aspects of Rhode Island’s socioeconomic profile, particularly by ethnoracial composition.
Table 1 points to some of the differential aspects of socioeconomic conditions by ethnoracial group in Rhode Island. Compared to non-Hispanic whites (”NH White”), individuals who are Black, Hispanic or other Persons of Color (“Other POC”) are more likely to be immigrants, have limited English ability, live beneath the poverty line, be uninsured, and live in higher density housing. Within the various groupings of persons of color, some of these characteristics are themselves unevenly distributed.
Hispanic, Black, and Other POC groups all contain over thirty percent immigrants (vs five percent for Whites), yet it is the Hispanic population which has the highest fraction of individuals who face challenges with English. Poverty has a much higher prevalence in communities of color as well, with the poverty rate for Hispanics (29.7%) and Blacks (23.7%) well above the rate for whites (12.4%).
Access to health insurance is also quite unevenly distributed, with sharp differences manifest across the three subgroups of persons of color. It is within the Hispanic population where the lack of insurance is most prevalent; about 1 in 8 Hispanics is uninsured in Rhode Island, versus about 1 in 30 for whites, with Blacks and Other POC intermediate.
Finally, housing conditions may matter much more in the COVID-19 crisis, not only because they are reflective of overall access to resources, but because density in housing (as well as other features of local life) may be linked to risk and exposure. Here, persons of color are again in different circumstances, with all three ethnoracial groups showing twice the rate of living in high density housing as whites. This measure is calculated from Census Bureau data indicating the number of households in the structure, and is tabulated to reflect those living in structures with 3 or more households present. For instance, some 46.7 percent of Hispanic persons live in these denser housing circumstances. While we cannot discern from these Census Bureau data the physical layout of these dwellings, there is certainly a precondition for more cross-household proximity and contact.
| Foreign Born | Limited English | In Poverty | Uninsured | Dense Housing | |
|---|---|---|---|---|---|
| Hispanic | 36.40% | 20.60% | 29.70% | 12.20% | 46.70% |
| Black | 30.60% | 3.80% | 23.70% | 7.30% | 43.20% |
| Other POC | 38.70% | 7.90% | 22.70% | 6.60% | 35.20% |
| NH White | 5.20% | 0.90% | 12.40% | 3.20% | 16.60% |
Table 1. Sociodemographic Conditions for Ethnoracial Groups in Rhode Island
Notes: Tabulations are based on categories listed in the 2018 American Community Survey Data 5-year sample. Data Obtained from IPUMS at the University of Minnesota Population Center. Weighted for sampling distribution on 52,706 persons (Hispanic 5,802; NH Black 2,306 Other POC 3,209; NH White 41,352) All tabulations show the distribution of persons, so as to reflect differential household size. See technical Appendix for more details on definitions.
Occupational circumstances also can place persons at differential risk. Table 2 presents the leading occupations (among workers in the American Community Survey [ACS] Census Bureau data). For the Black and Hispanic populations, these account for nearly half of all occupations. All three ethnoracial groups represented in the table have numerous workers who are in occupations that might be at higher risk: occupations that are more likely to be classified as essential workers; jobs that may require close contact. (We cannot discern such exposure risks directly from these data, of course.) Several occupations often mentioned as front-line or higher risk are among those listed for Hispanic and Black workers, but it is also important to note that these occupational distributions – including the ones that might be at greater risk-- are not identical across groups. For example, nursing assistants and personal care aides account for over twelve percent of Black workers, but only nursing assistants (at 2.6%) ranks among the leading occupations for Hispanic workers. The category of janitors and building cleaners (3.9%) is the leading occupation tabulated for Hispanic workers, but is not among the top five (at 2.4%) among Blacks. Drivers are prominent among both Hispanic and Black workers. Non-Hispanic whites also show occupational distribution that include several of these types of jobs, although they are less frequent than in the Hispanic and Black populations. By contrast, elementary and middle school teachers are reported as the leading occupational category (2.8%) among whites.
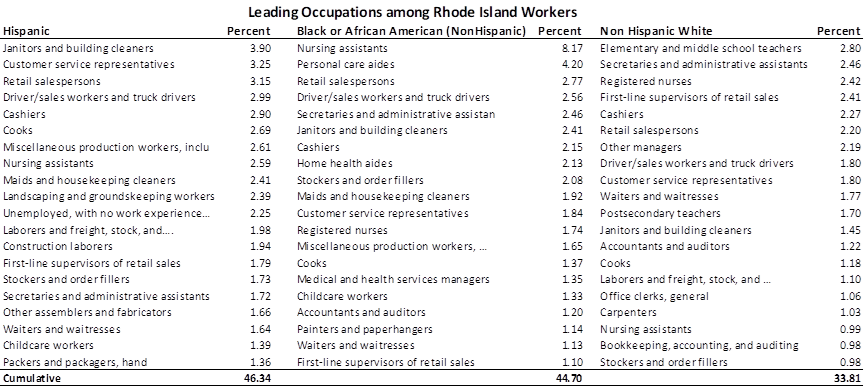
Table 2. Leading Occupations among Rhode Island Workers, by ethnoracial group
Notes: Tabulations from 2018 American Community Survey Data 5-year sample. Data Obtained from IPUMS at the University of Minnesota Population Center. Weighted for sampling distribution. Based on N=25,862 persons in the Labor Force and reporting an occupation (Hispanic N 2643; Black N 1153 NH White N 22066); . This tabulation includes only persons reporting as Hispanic (Hispanic) of any race; Black Only race (and not Hispanic), and White (and not Hispanic).
Final Considerations
This report has provided some description of the geographic and socioeconomic patterns and trends that characterize the COVID-19 situation in Rhode Island. Amid myriad constraints, Rhode Island responded aggressively to the pandemic. Case rates have come down statewide, although those groups and communities with elevated rates have remained at greater risk over time.
-
The apparent stability of this disparate impact argues for an increased attention to strategies to fight the pandemic among the hardest-hit communities and socioeconomic groups.
-
Our analysis could identify only fairly broad differences across groups. Digging more deeply may pay dividends for planning. For instance, while we show the impact on individuals residing in larger households and more dense places, sorting out the relative importance of household size versus housing unit density, for example, would be valuable. We also see that occupations that may lead to greater risks are not present equivalently among communities of color. This suggests that while concern for communities of color is well-placed, occupational diversity within these communities and consequent COVID-19 risk, should be considered as well.
-
The US Census Bureau Pulse survey ran through July 21, and showed an increasing positive trend for reports on household income loss during its last few weeks. This augments concern about the impending end of federal and state employment and income safety net measures, and supporting calls for policy intervention. More detail about employment changes in the Pulse data, which has the advantage of frequency but is limited to a general household response, might help better track the economic impacts and their after-effects.
-
Analyzing individual Rhode Island case data is not possible here. But doing so, while maintaining privacy strictures (such as through a RI survey) would likely help shine a brighter light on the competing factors for COVID-19 transmission. Note also that our results for RI municipalities necessarily assume that reported cases reflect actual prevalence in the population. The possibility of geographic variation in testing outreach and severity of symptoms should be considered in future data management.
Our working group will continue to place supplementary and updated material on the S4 website.
APPENDIX – DATA SOURCES AND METHODS
COVID-19 Case Data for Rhode Island
COVID-19 case data (in Figures 1, 2, supplement) come from the Rhode Island Department of Health Data Hub. For mapping we use these data and associated publicly available shape files for Rhode Island municipalities.
Discussions of “April” and “July” are approximations for ease of exposition. Municipality data are reported weekly and aggregated into 4-week periods by S4. April data reflects the period from March 29 to April 25. July data reflects the period from June 28 to July 25. Case Rates reflect number of people per 100,000 persons (based on 2018 US Census Bureau population estimates) who tested positive during respective time periods.
On the geographic assignment of cases, the Rhode Island Department of Health reports: “Residents in congregate care settings such as nursing homes, assisted living facilities, group homes, correctional facilities, and homeless shelters are intentionally excluded from these data. Because congregate care settings are not distributed equally across the state, and because spread within a congregate care setting does not correlate to spread within the community in which it resides, these cases have been excluded from this analysis in order to provide a more accurate picture of the general COVID-19 incidence within a municipality. In any scenario in which it is unclear whether a case is a congregate care resident or staff, that case is included in this analysis.”
Source: RIDOH COVID-19 Data (Data Download: 3 August 2020)
Geographic Mobility Data
These data come from publicly available “Community Mobility data” provide by Google. We have downloaded these data for all US States. The Workplaces, Residential Changes & Park Changes figures (Fig 3-5) represent the time trend for Rhode Island entries plotted alongside the trend for the median value across all US States. In these trend graphs, the percentage change over time is a relative measure compared to its baseline value for that day of the week with respect to the number of visitors or duration for key types of places. The baseline is the median value from the 5-week period between Jan 3 – Feb 6, 2020.
Note that these data rely on enabled location services signals from individual devices. The Google mobility data tracks responses within the borders of Rhode Island (and the other states), and do not necessarily represent the geographic locations of Rhode Island residents. The Google Mobility Datasets are sourced from users who have opted in to Location History in their Google Account. The Location History setting is disabled by default and users can choose to enable or disable at any point. The datasets are developed with aggregated and anonymized sets of data from opted-in Google users. No personally identifiable information is made public in the datasets to preserve privacy.
The datasets categorize places’ activities into groups with similar characteristics, such as residences, workplaces, parks, and the like. The data show how visitors to (or time spent in) places change compared to (pre-pandemic) baseline values, as mentioned above. Google does not indicate the number of observations on which its data and trends are based. Details about the definitions of groups and baseline values can be found in Google’s help documentation
Reference: Google LLC "Google COVID-19 Community Mobility Reports". https://www.google.com/covid19/mobility
Pulse Microdata Analysis
Figures 6 & 7 display the aggregate pulse data downloaded from the Census Bureau Pulse website. Additional interactive tabulations and more variables, along with more details on survey design, are available at the Census Bureau’s interactive Pulse website
For US Census Bureau technical information on the Pulse Survey, see:
https://www2.census.gov/programs-surveys/demo/technical-documentation/hhp/2020_HPS_Background.pdf
The questions asked of Household Pulse Survey Respondents were as follows:
- For Household Economic Loss: Have you, or has anyone in your household experienced a loss of employment income since March 13, 2020?
- For Food Scarcity: In the last 7 days, which of these statements best describes the food eaten in your household?
- For Anxiety (examined in supplementary analysis): Over the last 7 days, how often have you been bothered by the following problems ... Feeling nervous, anxious, or on edge? Would you say not at all, several days, more than half the days, or nearly every day
Pulse data are subject to sampling variability. The sample size for the Total US Pulse Survey averages about 90,000 responses per week. The sample size for Rhode Island averages 1,244 weekly (max 1775; min 523, based on our tabulations of microdata).
Questions asked and Census Bureau tabulation categories (coding) in the Pulse Survey with respect to Spanish Origin and Race are as follows:
-
Are you of Hispanic, Latino, or Spanish origin?
- Census Bureau Pulse tabulation categories for Spanish Origin are "1) No, not of Hispanic, Latino, or Spanish origin ; 2) Yes, of Hispanic, Latino, or Spanish origin"
-
What is your race? Please select all that apply.
- Census Bureau Pulse tabulation categories for race are: "1) White, Alone; 2) Black, Alone; 3) Asian, Alone; 4) Any other race alone, or race in combination"
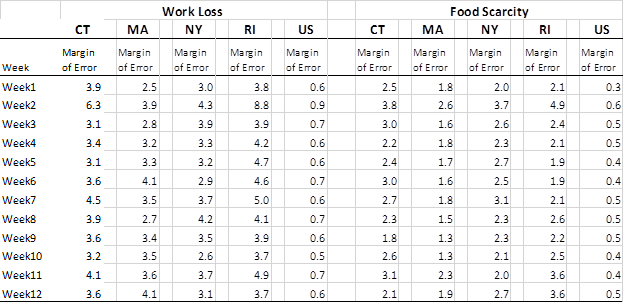
Table A-1: Margin of Error values for 90% Confidence Interval in Census Bureau Pulse data
Source: US Census Bureau. Pulse
Survey website (Tabulated Data Download 2 August 2020)
Social and Demographic Characteristics of the Rhode Island Population
Notes: Tabulations are based on categories listed in the 2018 American Community Survey Data 5-year sample. Data were obtained from Integrated Public Use Microdata Sample (IPUMS) at the University of Minnesota Population Center and weighted for sampling distribution of 52,706 persons. All tabulations show the distribution of persons, so as to reflect differential household size. Some item tabulations have fewer individuals, due to restrictions in the universe.
Foreign Born are those born outside the United States, Puerto Rico, and other US territories. “Limited English” includes those who speak no English and those who are reported to speak English, “but not well.” “In Poverty” includes those who fall below the poverty line, as recorded in the Census Bureau ACS data. Uninsured is recorded for those who report “No health insurance coverage”, either government or private. “Dwellings 3+ HH” includes persons resident within structures that are a “3-4 family building” or larger.
Ethnoracial population groups are derived from the cross-classification of US Census Bureau categories for Race and Spanish Origin variables. Following Census Bureau practice, we tabulate Hispanics as those reporting Hispanic, Latino, or Spanish origin, irrespective of race. Among non-Hispanics, we tabulate those who report Black or African-American as “Black”; those who report “White” as white; and those who identify other racial group or two or more racial groups as other persons of color “Other POC”. These appear in Table 1; In Table 2 Other POC is not presented due to relatively small sample sizes to support accurate reporting. In general we adopt New York Times capitalization practice.
SUPPLEMENTARY MATERIAL
Figure S-1 presents the Case Rate for the 4-week period covering July across Rhode Island’s 39 cities and towns, with these municipalities labelled. (City and Towns are not separately identified in Figure 2, for reasons of presentation clarity). They are arranged by quintile with darker shading indicating communities with higher COVID-19 rates, and lighter shading indicating municipalities with lower to negligible rates. A map for the April period would look similar; thus, the geographic concentration of cases has remained about the same, even amidst an overall decline in cases.
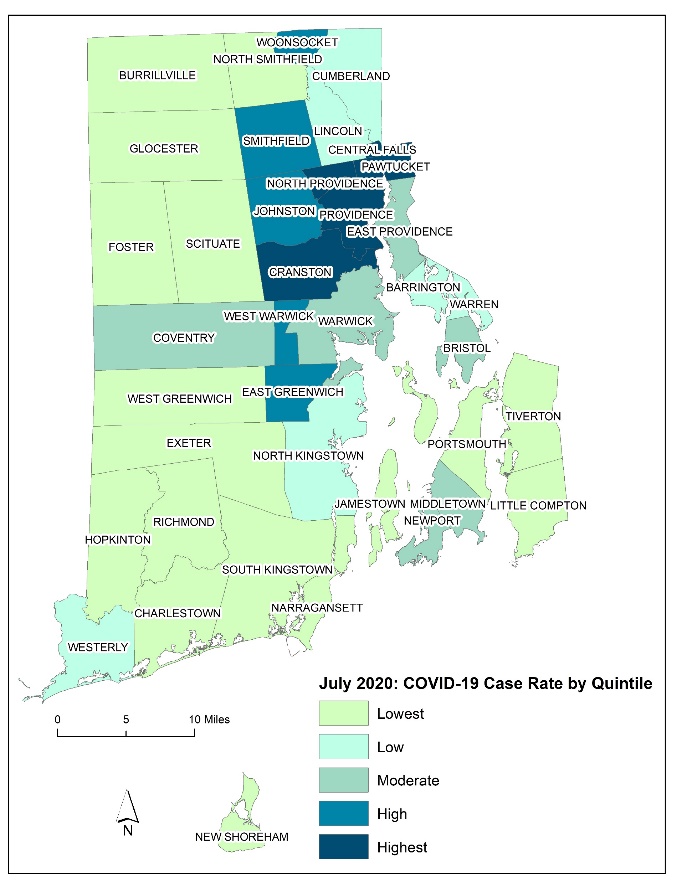
Figure S-1. COVID-19 Case Rates & Selected Population Characteristics in RI Cities & Towns
Notes: Case Rates reflect number of people per 100,000 (based on 2018 population estimates) who tested positive
during month of July. July data reflects the period June 28 to July 25. Municipalities are arranged by quintile
in terms of share of statewide cases.
Source: RIDOH
COVID-19 Data (Data Download: 3 August 2020)
Additional Maps for COVID-19 geographic distribution and for the distribution of ethnic and socioeconomic characteristics are available on the S4 website. The Rhode Island Department OF Health regularly updates case counts and rates by municipality and by Zip Code Tabulation Area (ZCTA).
Mobility Trends for “Retail & Recreation” classification
Figure S-2 depicts the trend for Google Community Mobility classified as Retail and Recreation. Since this category has a diverse mix of activities, trends are less clear. We note that Rhode Island and the median state display a precipitous decline from March into April with a recovery (in Rhode Island to near baseline levels) thereafter.
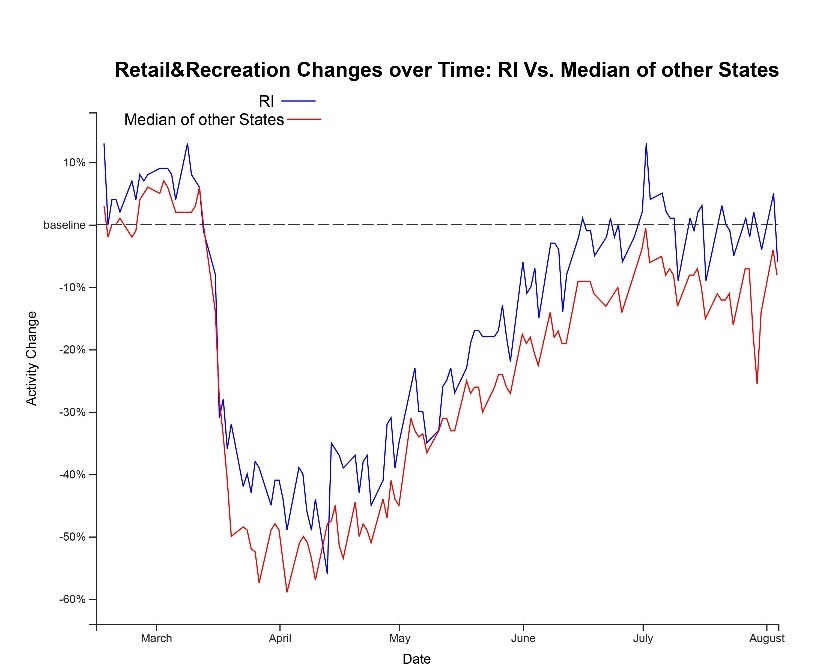
Figure S-2. Mobility Trends for “Retail & Recreation” classification.
Note: The percentage change is a relative measure compared to its baseline value for that day of the week with respect to the duration people spend at places classified as Retail and Recreation. The baseline is the median value from 5-week period Jan 3 – Feb 6, 2020.
Pulse Microdata Analysis
We have extended our examination of the issue by working with the full Pulse microdata from the Census Bureau (publicly available). This allows us to also control for other characteristics, and see how Rhode Island’s outcomes—for economic loss, food security—differ from its neighbors (Connecticut, Massachusetts, and New York) and the rest of the United States after adjusting for these other characteristics. We estimate statistical models that also control for sex, age and ethnoracial group of the respondent (Census-based classifications Black, Hispanic, Asian, Other, versus Non-Hispanic White) and household size. The statistical model predicting Food Scarcity also controls for Economic Loss.
In Figures S3 below, we present coefficient plots (with associated error bar to indicate 95 percent confidence intervals) from logistic regression for these outcomes in Week 12, the final week of the survey for which we have data. Relative position on the graph indicates the predicted influence of a one-unit change in that variable on the odds of the outcome of interest. Values farther from 1.0 (and for which the error bars do not cross 1.0) are taken to be more influential and of greater statistical significance.
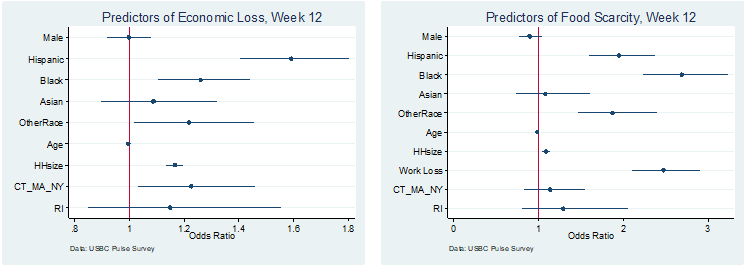
Figure S3. Coefficient Plots for Microdata Analysis of Economic Loss and Food Scarcity, Week 12.
Notes: Reference categories are: Female, Non-Hispanic White, and All other US states. Age and HH Size (= Household Size) are continuous variables with no reference category. The Food Scarcity model includes a predictor variable for Household Economic Loss response (WorkLoss=”yes”).
In these microdata analyses we find that persons of color are more likely to report Household Economic Income Loss, controlling for age, sex, and household size. Hispanic individuals report household income loss from work about 1.6 times that of whites. Results for Blacks and those reporting “Other Race” are also elevated (at about 1.2), but are somewhat below Hispanics. Individuals of Asian origin also show elevated impact, although we cannot estimate effects as precisely. Individuals in larger households indicate elevated loss. This could be due partly to the presence of a wider group of household members who may have seen an employment shortfall, but it may also reflect an impact on larger families; more detailed analysis would be needed to sort this out. Older individuals (but still under age 65) are less likely to indicate job income loss. Differences by sex (of respondent) are negligible in Week 12.
When controlling for these other characteristics in Week 12 Rhode Island and its neighbors are predicted to have higher levels of economic loss than the rest of the country, although the Rhode Island value is estimated with little precision.
Food Scarcity exhibits a close link to reported Economic Income Loss. In most weeks, those reporting Economic Income Loss in their household are more than twice as likely to report Food Scarcity. Black respondents are estimated to have the highest level of food insecurity, above that of Hispanics and Asian individuals. (The last group exhibits no difference from the reference group of whites.) Recall that there was an uptick nationally in reported food insecurity in the final few weeks of the survey (Figure 7). For both Rhode Island and its three Northeastern neighbors, the model predicts an elevated level of reported food scarcity, although the errors bar crosses zero and these differences cannot be asserted to be statistically significant.
We generally follow the practice of our data source for race and ethnic categories in this report. In some cases, multiple terms are used in the source. See the Appendix for more details. ↩︎
Data from Case Demographics, Percent of COVID-19 Cases by Race/Ethnicity.
https://ri-department-of-health-covid-19-response-testin-c9214-rihealth.hub.arcgis.com/
Accessed 11 August 2020. ↩︎https://www.nytimes.com/interactive/2020/us/coronavirus-spread.html ↩︎
https://www.nytimes.com/2020/08/02/health/dr-birx-coronavirus-phase.html ↩︎
Providence Journal online posted Jul 18, 2020 at 6:27 PM ↩︎
Providence Journal print edition 30 July 2020. ↩︎
“April” data reflect the period from March 29 to April 2; “July” data reflect the period from June 28 to July 25. ↩︎
These values exclude the cases indicated as “unknown” with respect to geography of residence. The RI DOH website states:" Does not include out of state residents or people with pending residence information ..." The number of entries marked “unknown” decreased over time, suggesting that some cased ” were later classified. ↩︎
According the RI Department of Health, “Residents in congregate care settings such as nursing homes, assisted living facilities, group homes, correctional facilities, and homeless shelters are intentionally excluded from these [municipality] data".RI Data Hub, “Municipal Case Trends”. ↩︎
Executive Order 2-13 issued by Governor Gina Raimondo. ↩︎
The Figure 3 trend and our interpretation differs from a report based on Unacast data for Rhode Island. Unacast uses the average distance traveled of participating users as a measure to represent mobility, and draws on selective applications. Google makes use of the time spent at places and the number of visitors to places. In our evaluation, Google's data is more representative and reaches a larger number of users (See data notes for more.).↩︎
The State of Rhode Island reported a 79% increase in visitors to state beaches in June 2020 over June of the previous year (https://www.ri.gov/press/view/38858). Places classified in Google Mobility as Retail and Recreation have also showed more activity (figure not shown) since the middle of April in RI. Other states show a similar increase. Since this category spans a number of physical settings (indoor, outdoor) and locations, it is more difficult to interpret. ↩︎
The meaning of “pulse” here refers to the mode of data collection—rapid, repeated, digital direct response, rather than its use in the nutrition field to refer to legumes. Week 1 was April 23 - May 5 (extended to two weeks); Week 2 was May 7-12; Week 12 was July 16 - July 21 ↩︎
Figures 6 and 7 are generated from the Census Bureau website interface for national data and specific states. Tables including margin of error calculations (from the Census Bureau) are included in the Appendix. In the supplementary material, we employ Pulse Survey microdata to look at outcomes in statistical analyses that control for the respondent’s personal and household characteristics. We include household income loss, food scarcity and anxiety. The anxiety outcome is not depicted in the Census Bureau interactive website and so can only be examined via the microdata. ↩︎
See Appendix for more details with respect to Census Bureau Pulse Survey and American Community Survey classification of persons by Race and Spanish Origin. ↩︎